- Fraction: A portion of a complete entity, expressed as a ratio.
- Percentage: A value expressed as a part of 100.
a/b:
a = numerator (top part of the fraction)
b = denominator (bottom part of the fraction, represented by “d” for down)
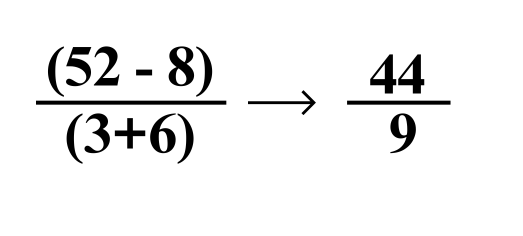
Order of Operations
PEMDAS (Order of Operations)
- P: Parentheses
- E: Exponents (or roots)
- M: Multiplication
- D: Division
- Perform multiplication and division in the order they occur from left to right.
- A: Addition
- S: Subtraction
- Perform addition and subtraction in the order they appear from left to right.
Example:
2 + 5 × 8
- Perform multiplication first.
- Then, proceed with addition.
Example:
(4 – 6) × ÷ 8
- Begin with parentheses.
- Then, calculate the root (if applicable).
- Follow with multiplication or division.
Standard & Metric Conversions
1 gal ………………………………… 3.8L
1 kg ………………………………… 2.2 lb
1 in ………………………………… 2.54 cm
1 m ………………………………… 3.28 ft
1 mi ………………………………… 1.6 km
1 oz ………………………………… 28.35 g
1 m ………………………………… 1.09 yd
Prefixes
kilo ………………………………… 1,000
deca …………………………………… 10
deci ………………………………… 1/10
centi ……………………………… 1/100
milli …………………………….. 1/1000
micro ……………………… 1,000,000
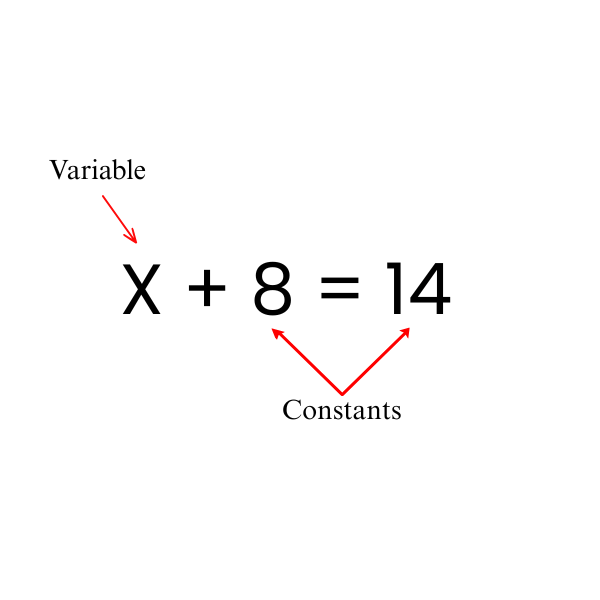
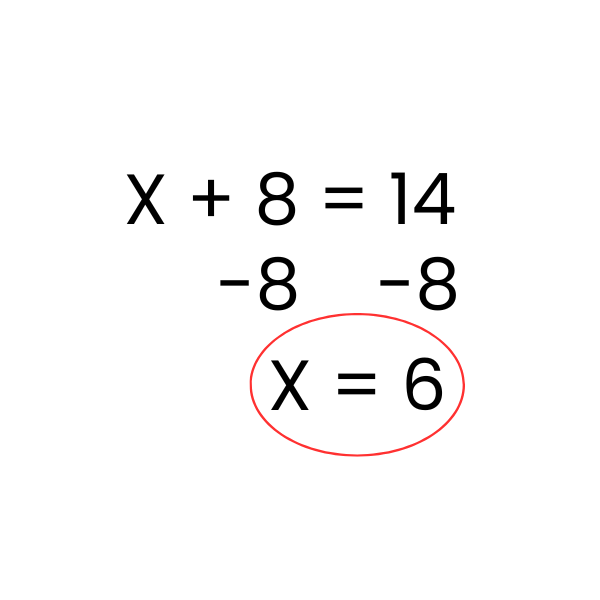
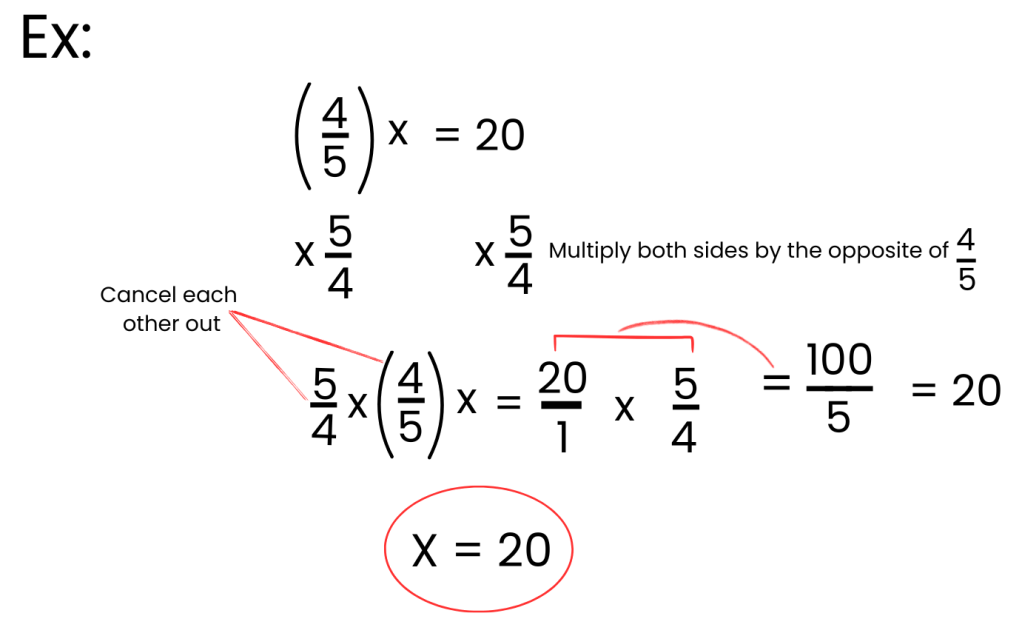
Value of Variable
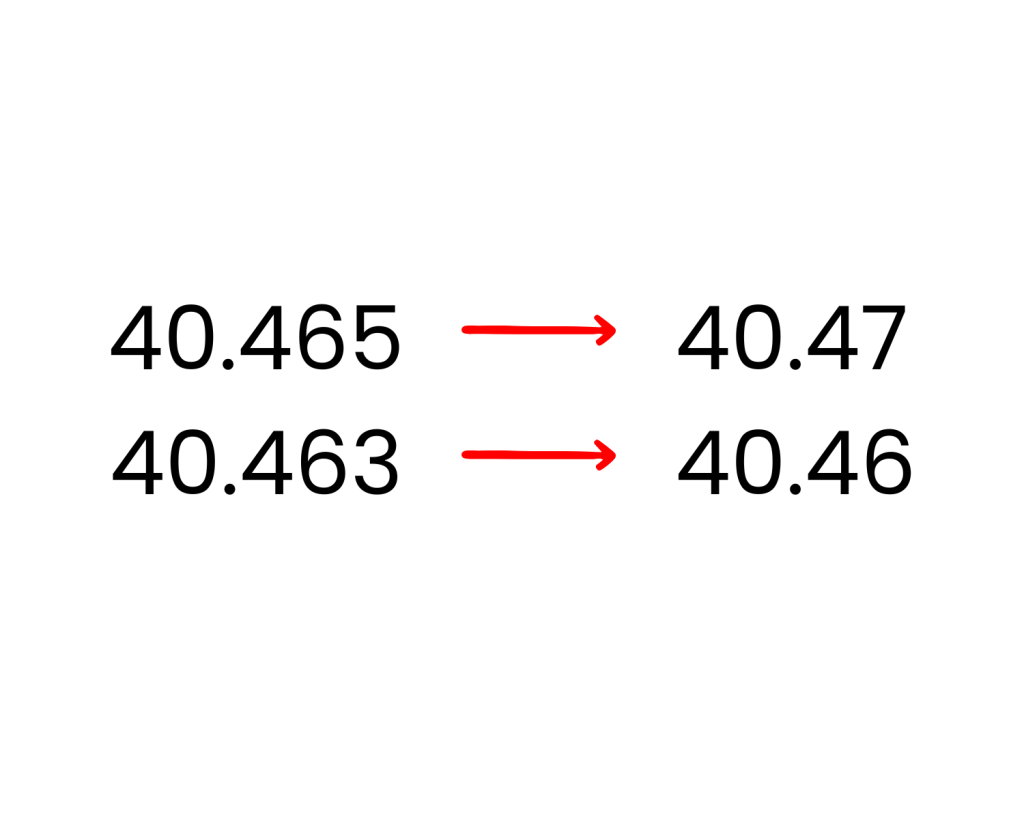
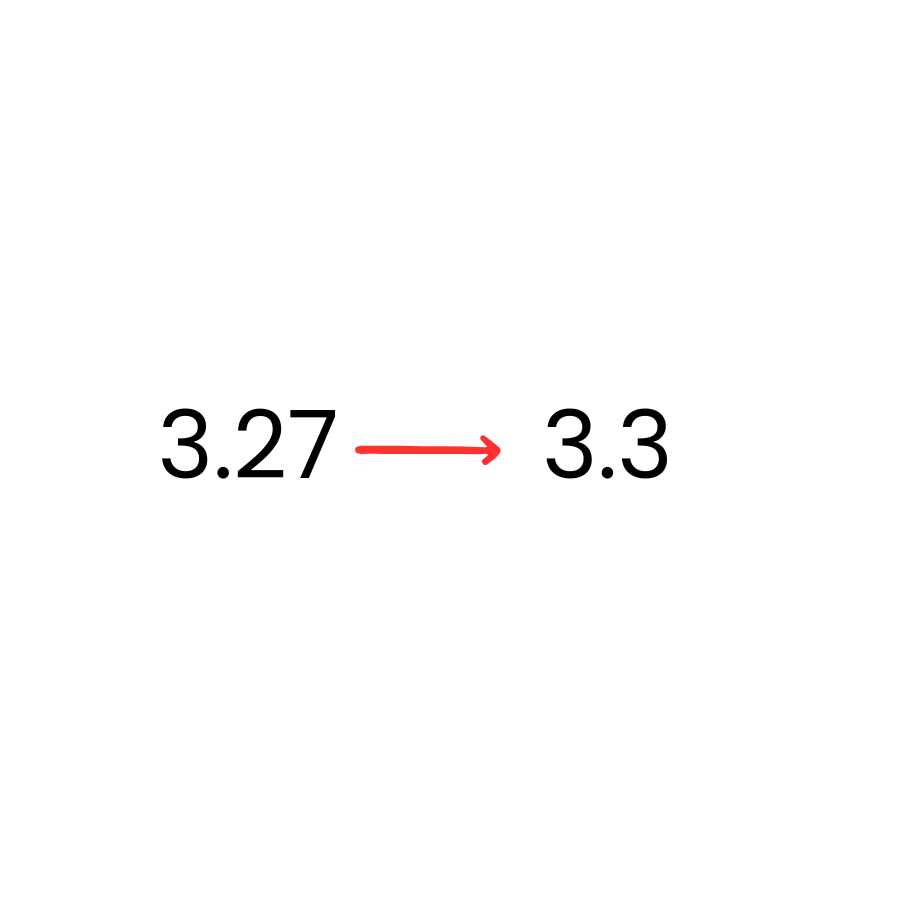
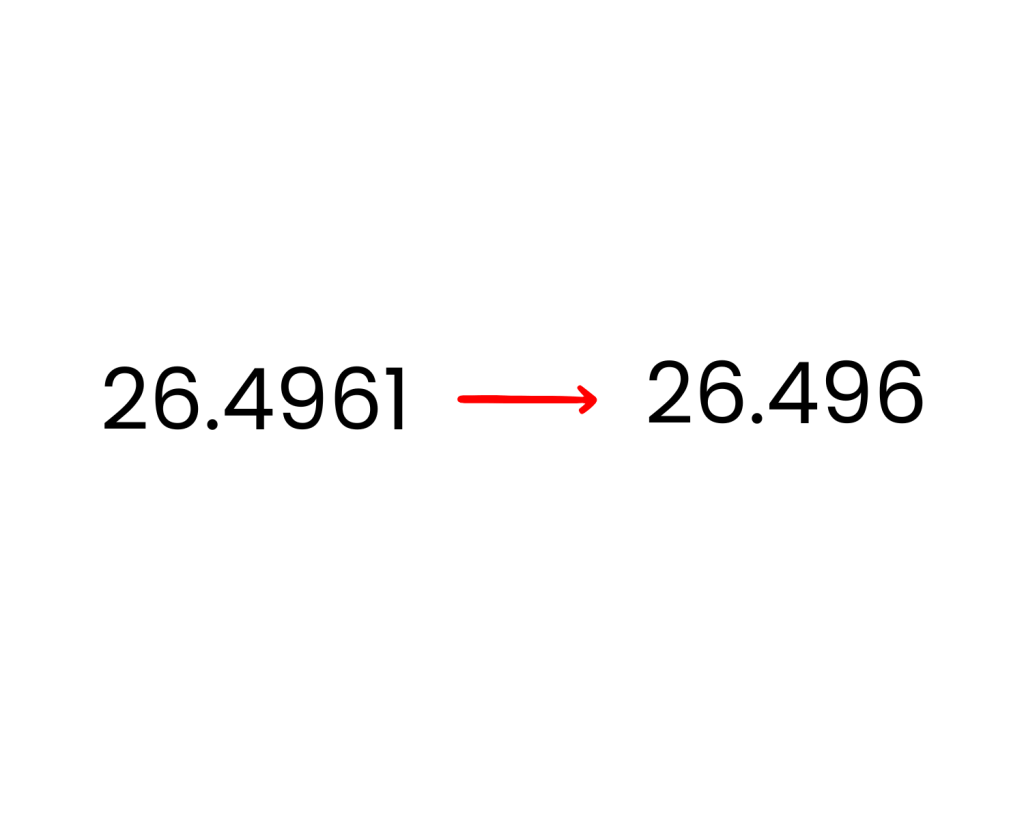
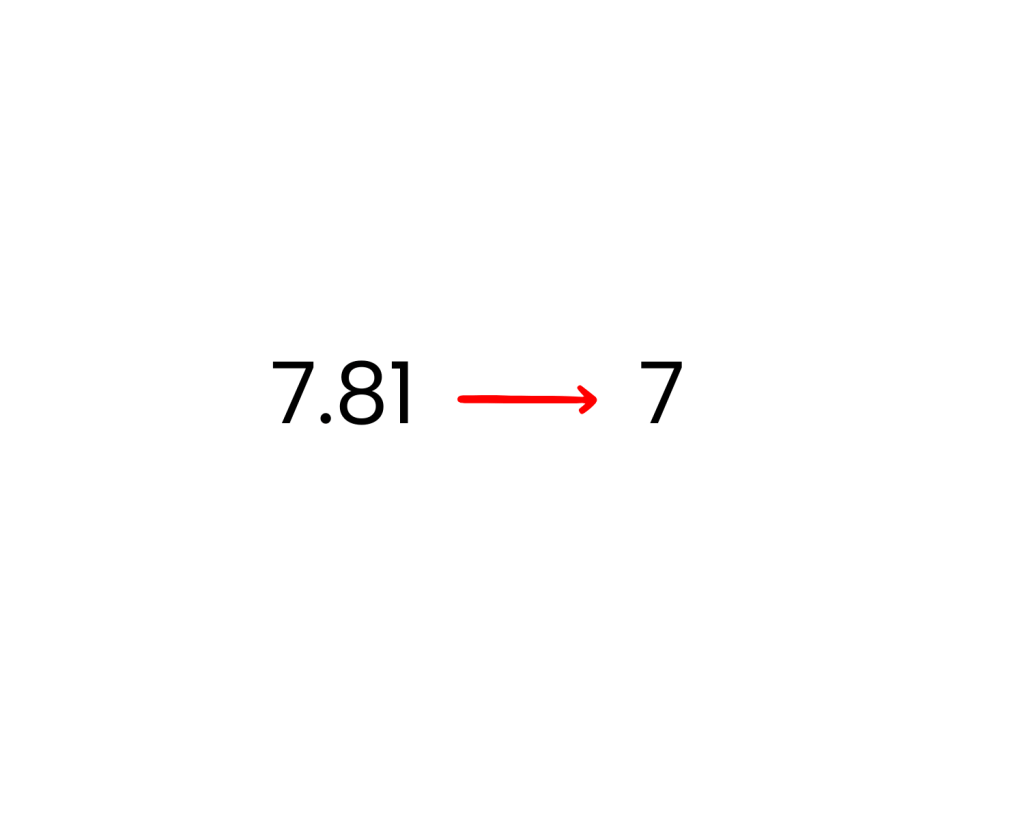
Rounding
Rate of Change
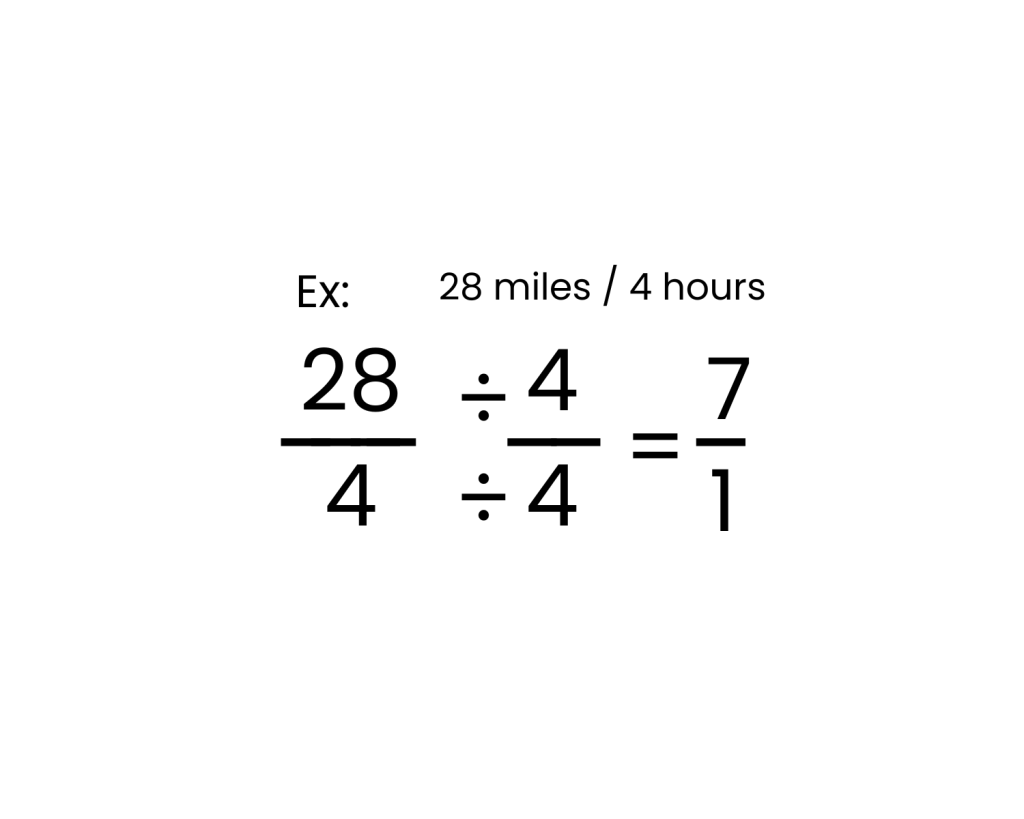
Ratio: the frequency one number fits into another.
Ex: 7/1
Rate: a comparative ratio expressed with specific units.
Ex: 7miles/Hour

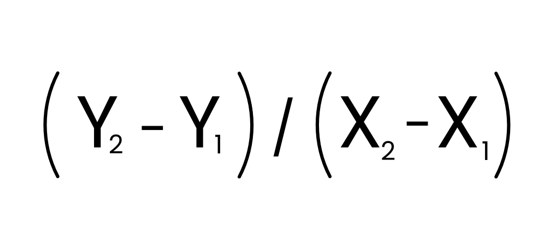
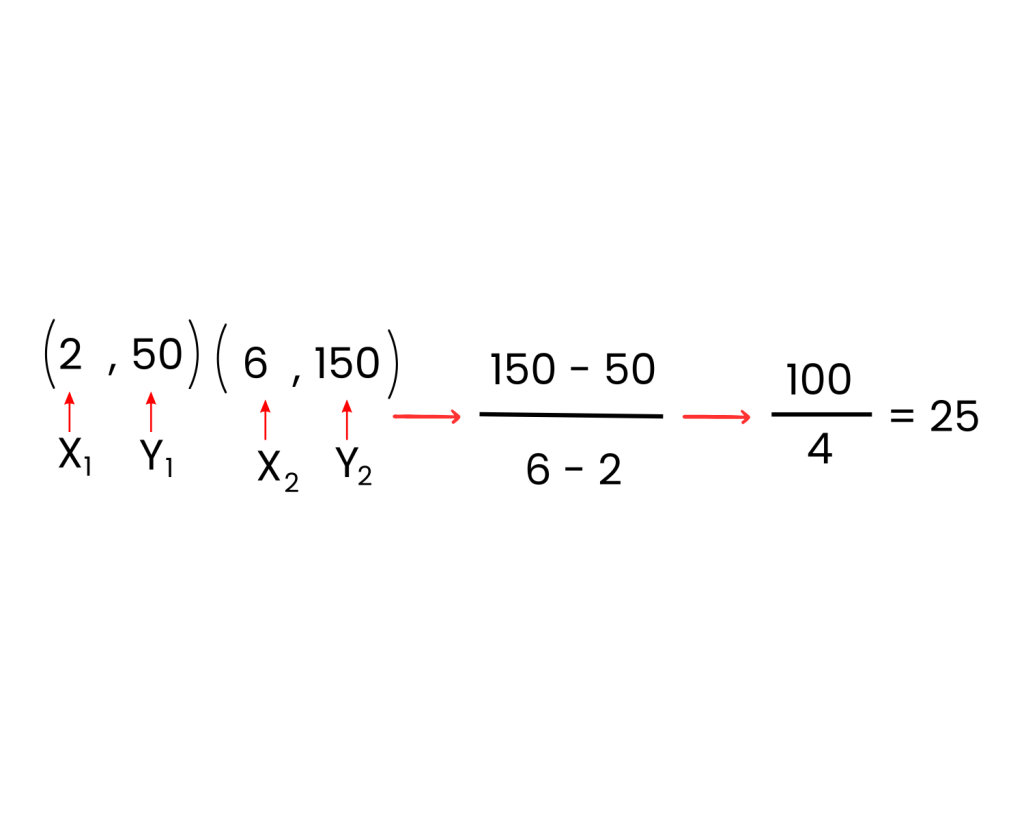
Determining the slope of a line using two points:
- Select any two plotted points.
- Divide the difference in y-coordinates by the difference in x-coordinates.
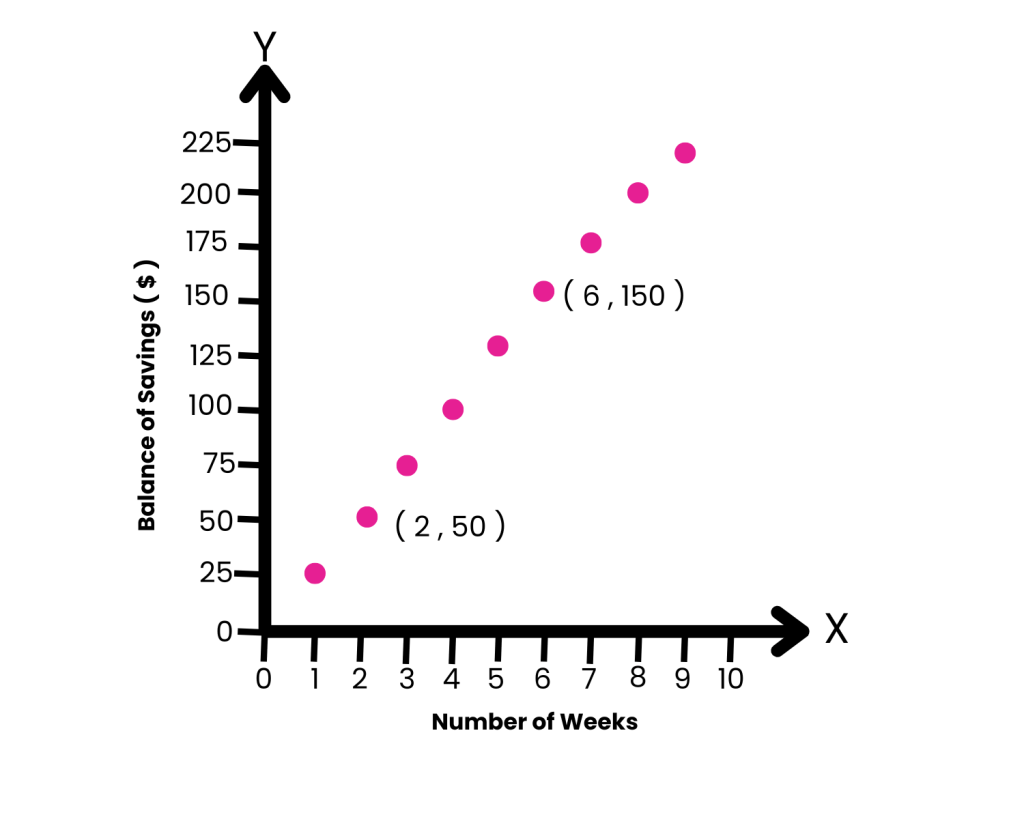
The equation for this graph is y = 25x + 0. (The line intersects the y-axis at 0.)
Expressions: Combinations of numbers, variables, and operations. Examples:
3x−1
-y
2(x−4)
Equations: Show relationships between expressions that are equal to each other. Examples:
2−y=20
8=x
3(x−1)=2(4x+5)
Inequalities: Show relationships between expressions that are not equal to each other. Examples:
8−4y <24x
x>4
2(x-10)≤ 3x +15
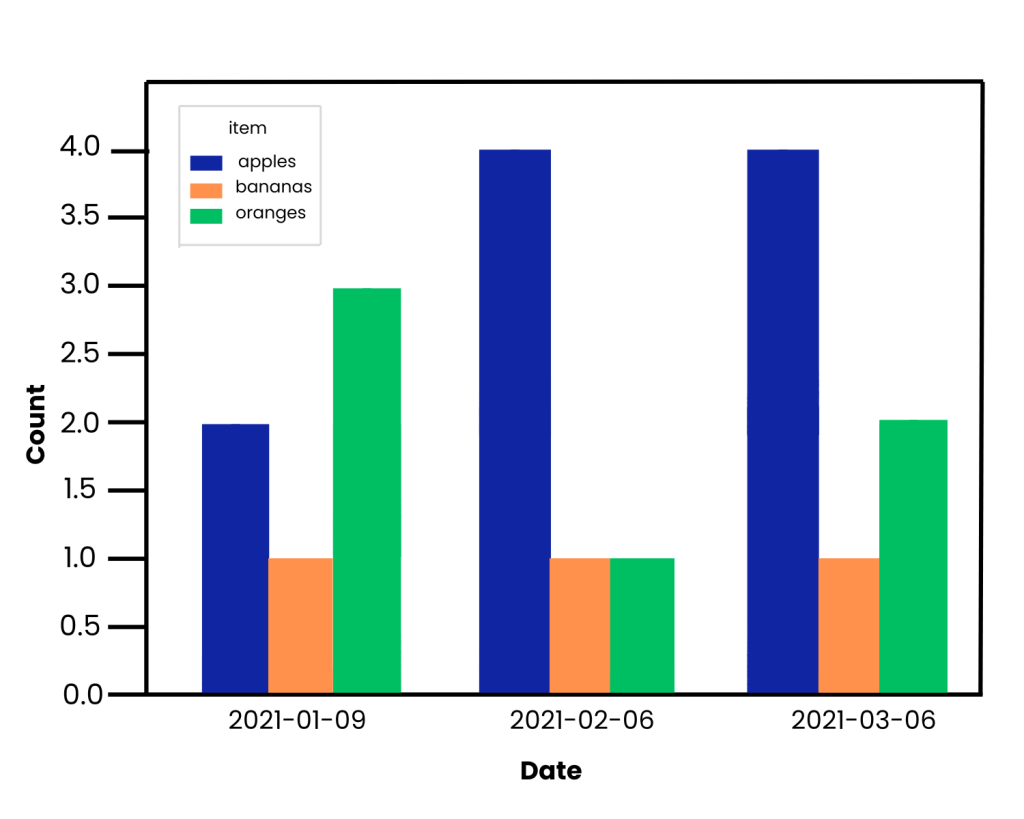
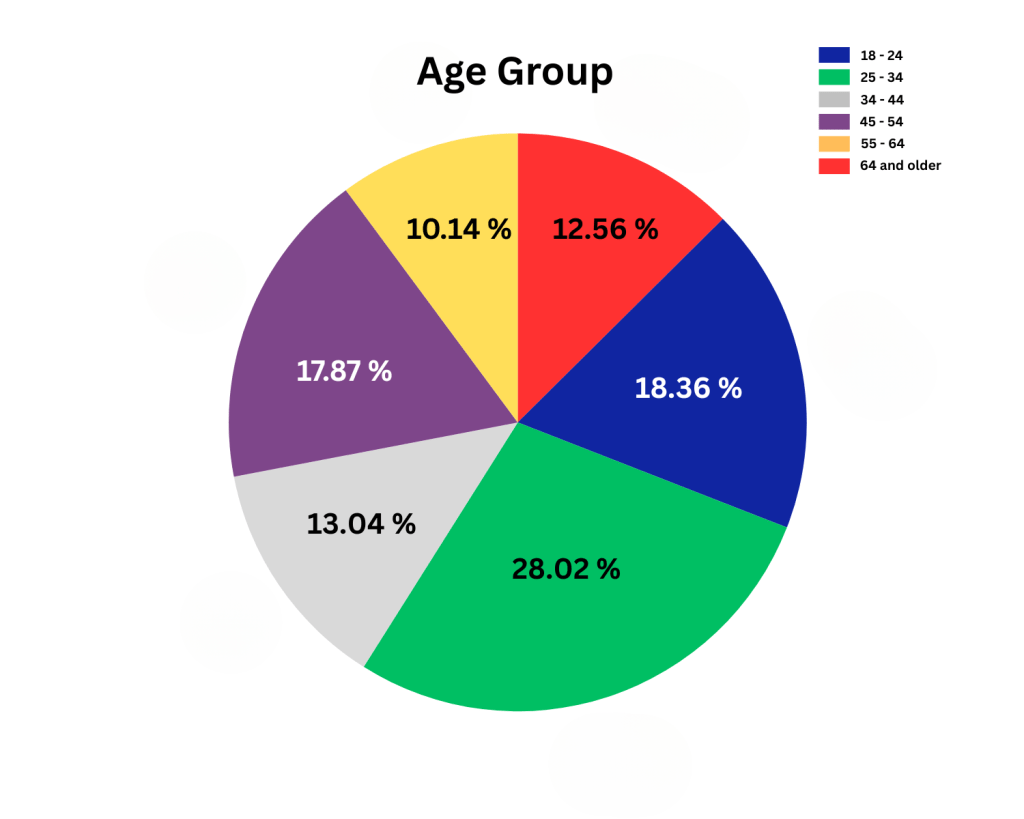
Other Graphs and Tables
Evaluating Data
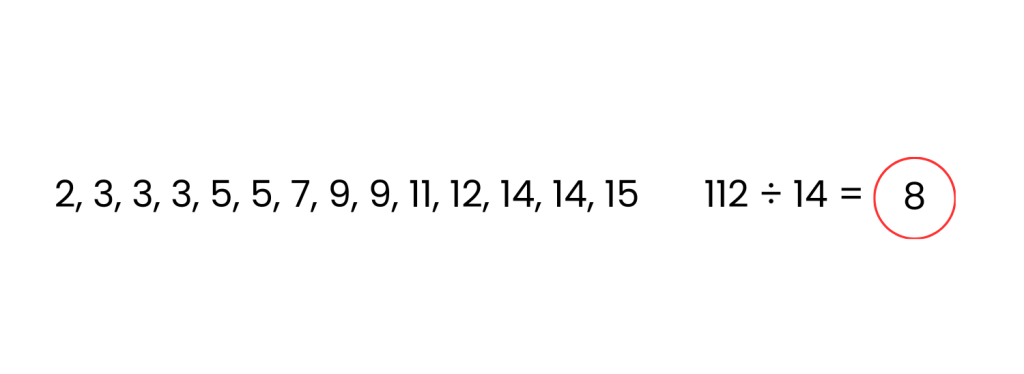
Mean: The average value of a data set. To calculate, sum all the values in the set and divide by the total number of values.
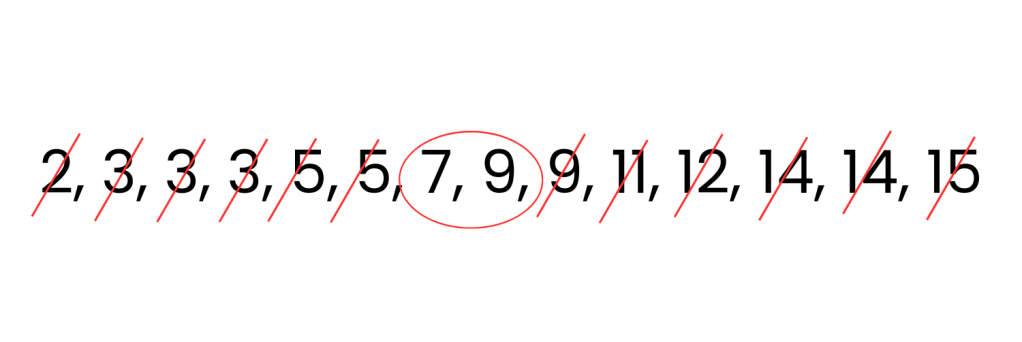
Median: The central value in a sorted list.
If the list has an odd number of items, there is a single median. If the list has an even number of items, there are two medians.
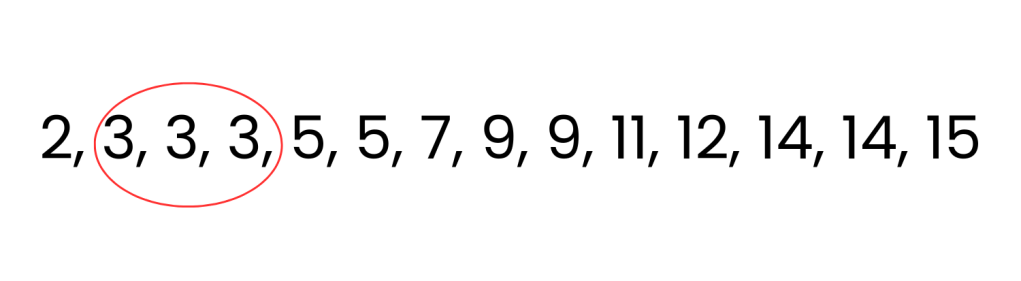
Mode: The value or values that appear most frequently in a data set.
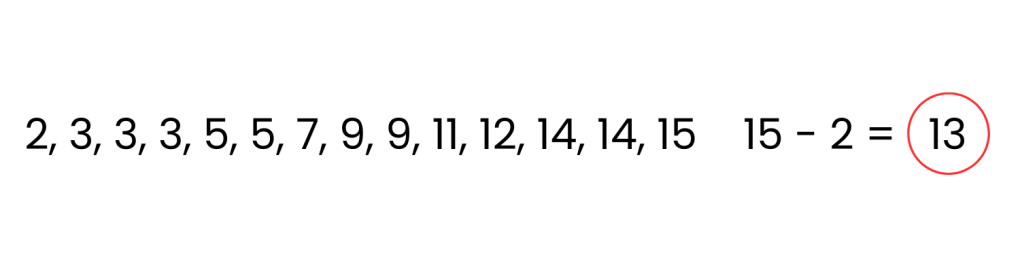
Range: The difference between the largest and smallest values in a data set. Find this by subtracting the smallest value from the largest.
Calculating Probability: To find the probability, divide the number of favorable outcomes by the total possible outcomes in the data set.
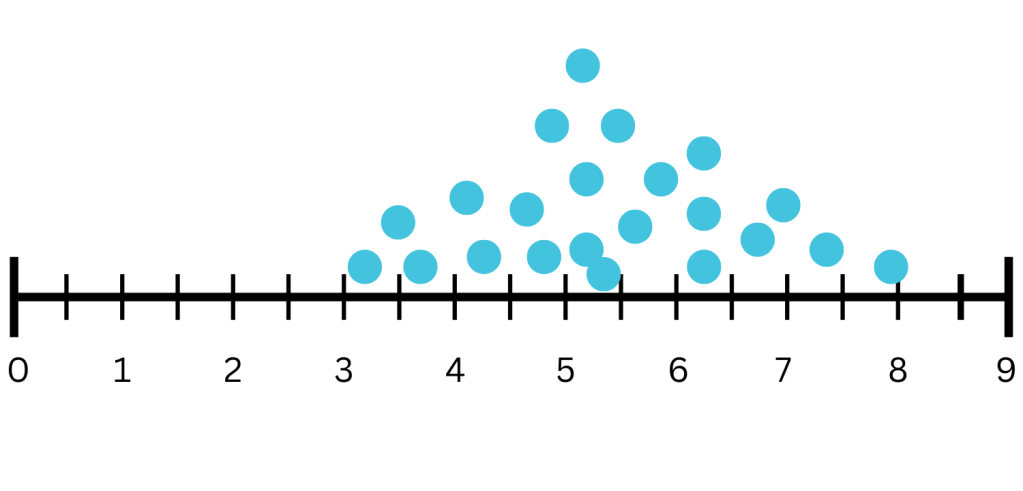
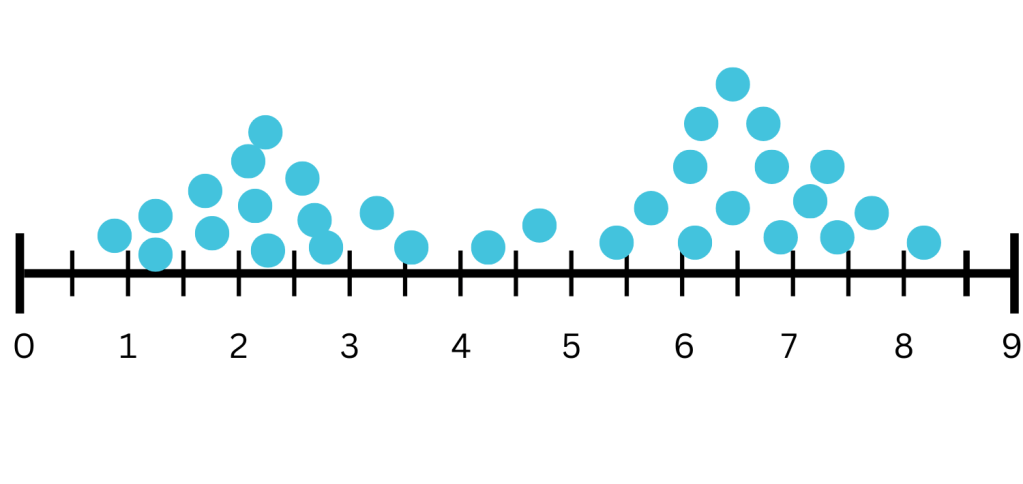
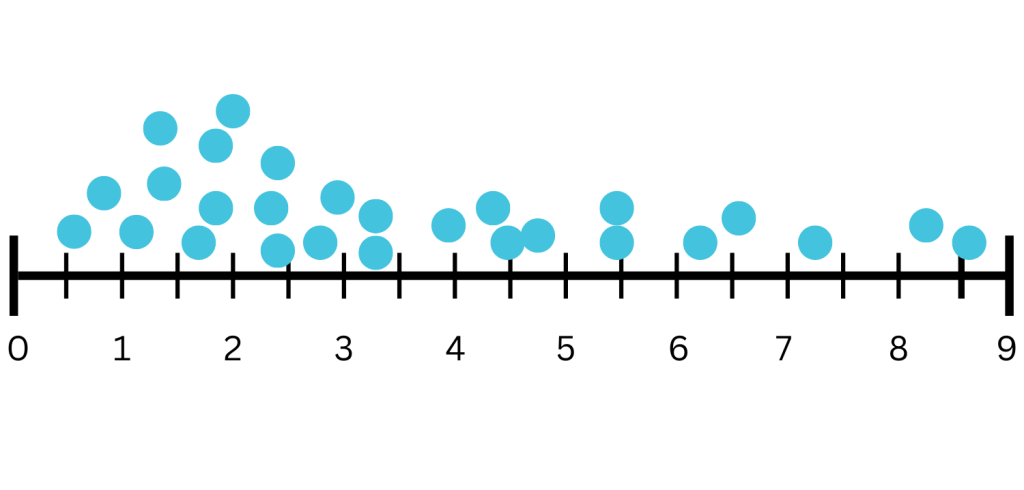
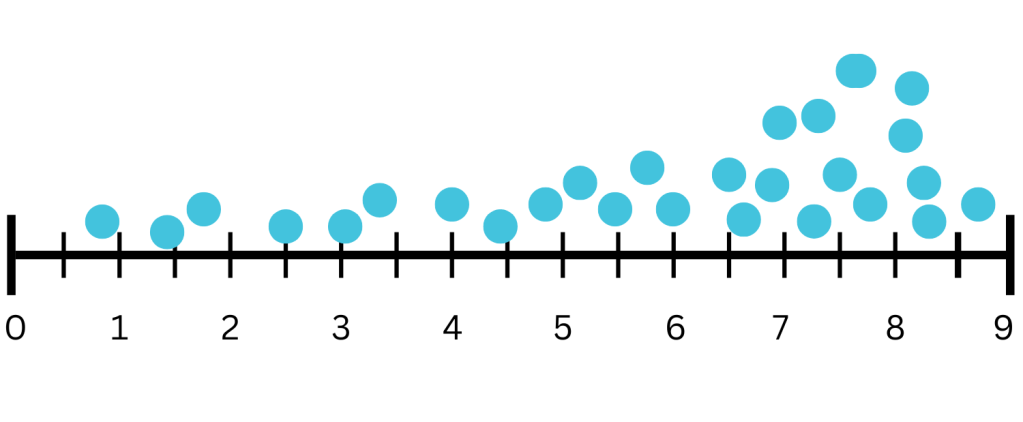
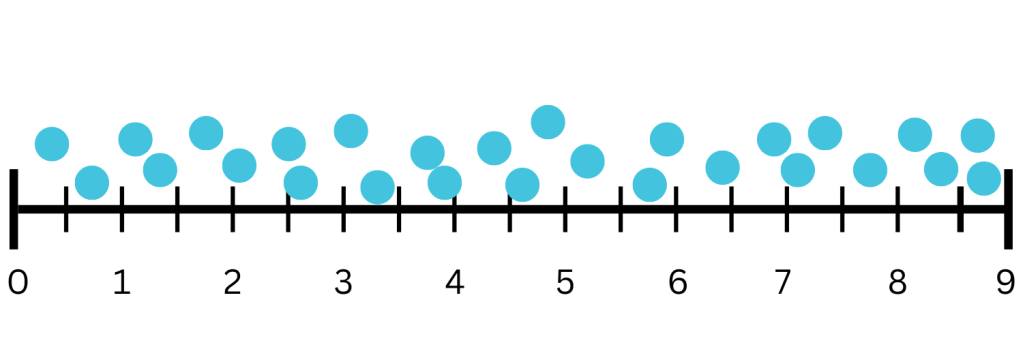
Distribution of Data
Symmetric Distribution: A type of data distribution where the plot is evenly divided at the center, with both halves being reflections of each other.
Perimeter and Area
Perimeter: The total length around a shape, calculated by adding the lengths of all its sides.
Circumference: The perimeter of a circle, representing the distance around it.
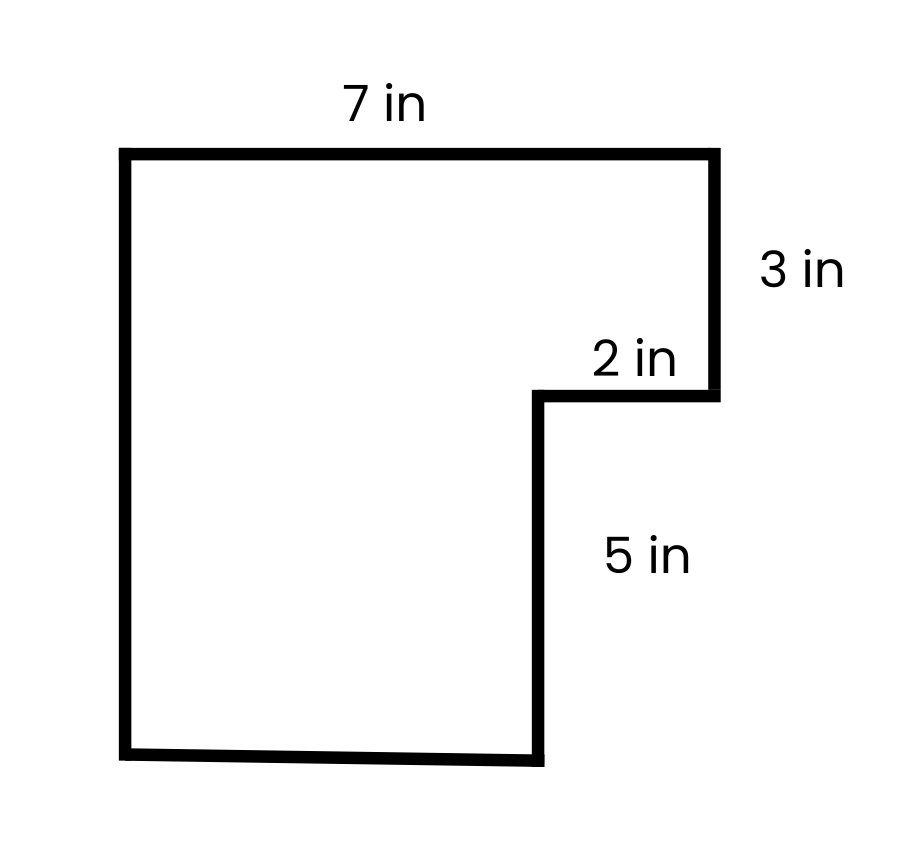
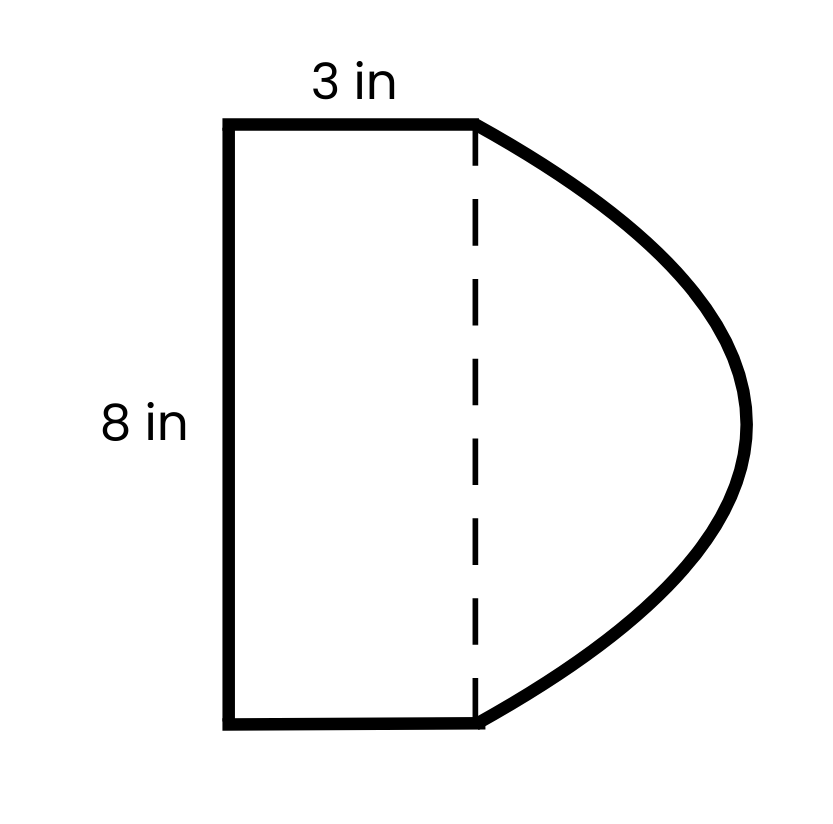
The radius is half of 8 in = 4in
π× 4 = 12.57
8 + 3 + 3 + 12.57 = 26.57 in

C = 2πr Or C πD
D – Diameter = two times the radius
C = 2π4 = 25.13 in
Area: the amount of space a surface covers, typically measured in square units (in², cm², m²).
A = 4 × 4 = 16 cm²

A = 6 × 3 = 18 cm²
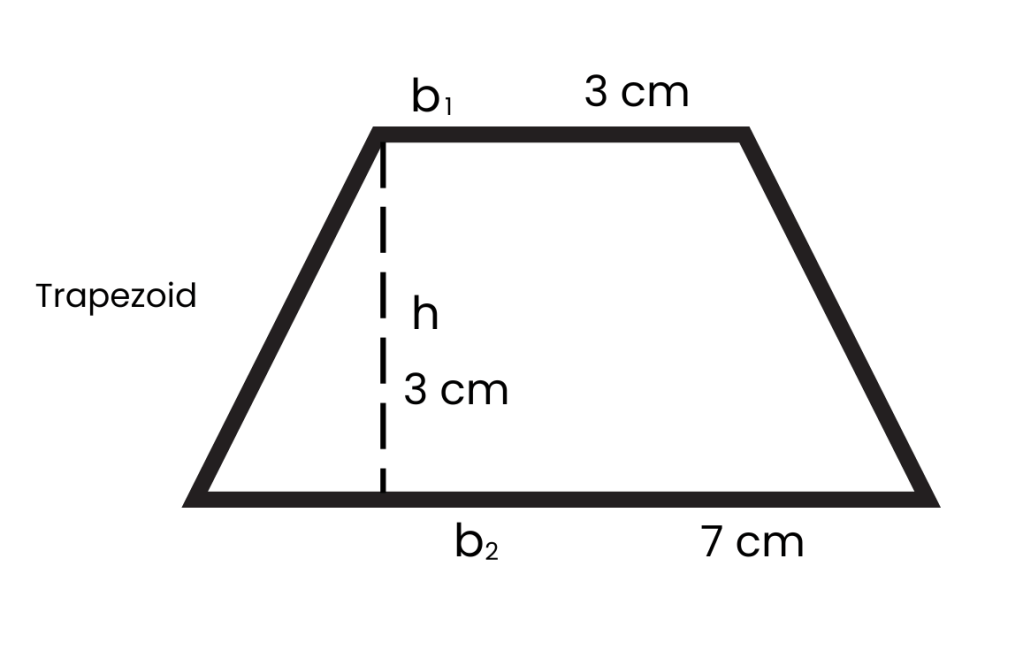
A = 1/2 × h × (b₁ + b₂)
A = 1/2 × 3 × (3 + 7) = 15 cm²
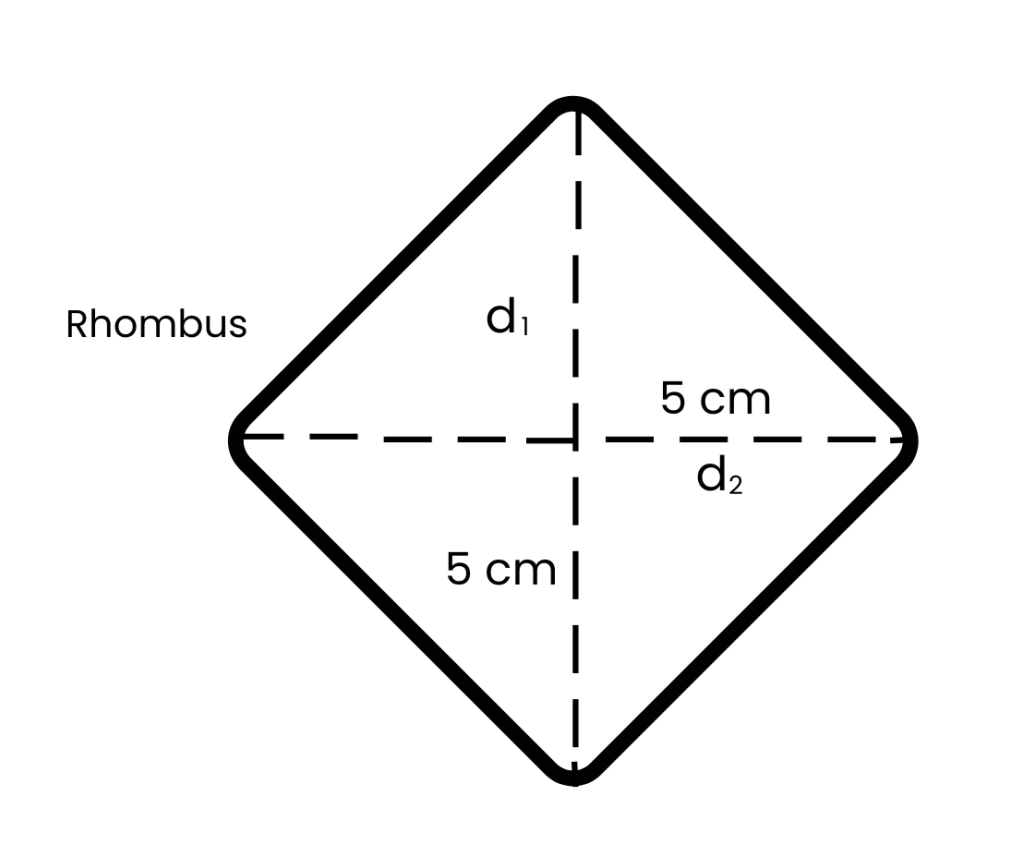
A = 1/2 × d₁ × d₂
A = 1/2 × (5 × 5) = 12.5 cm²
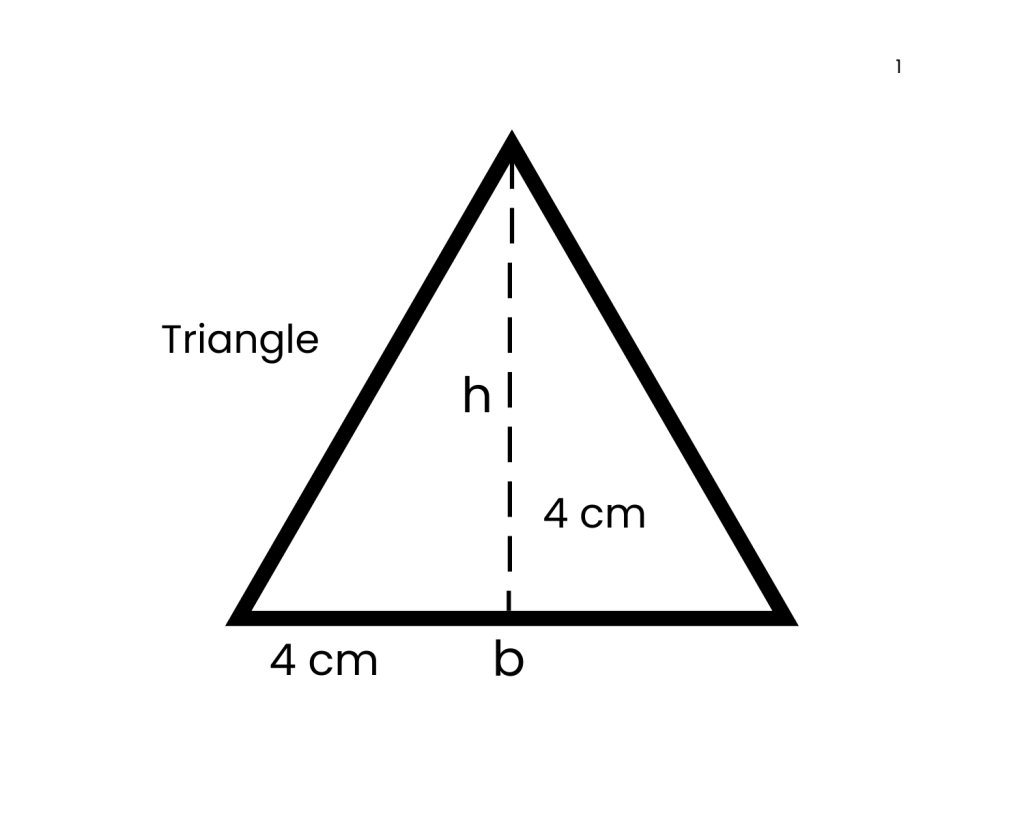
A = 1/2 b x h
A = 1/2 4 x r = 8 cm²
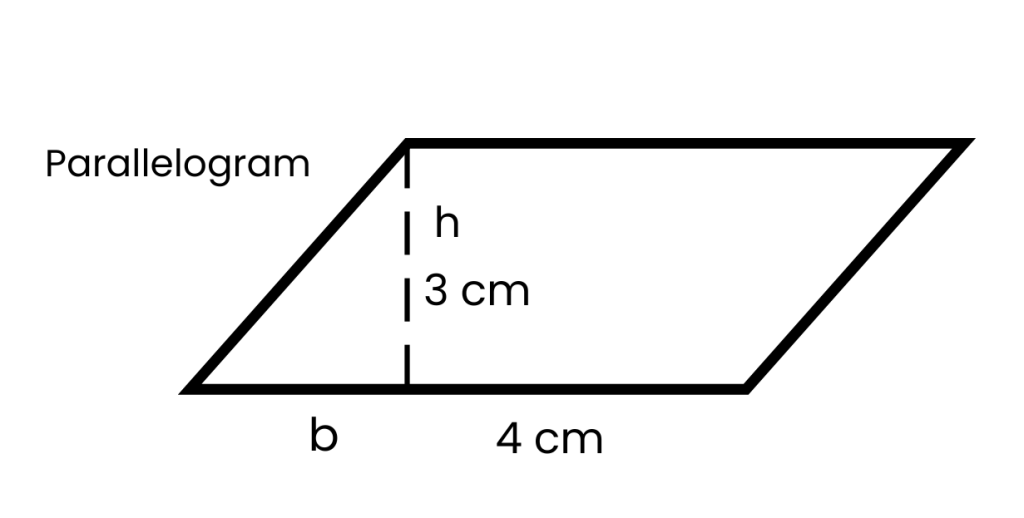
A = b x h
A = 4 x 3 = 12 cm²
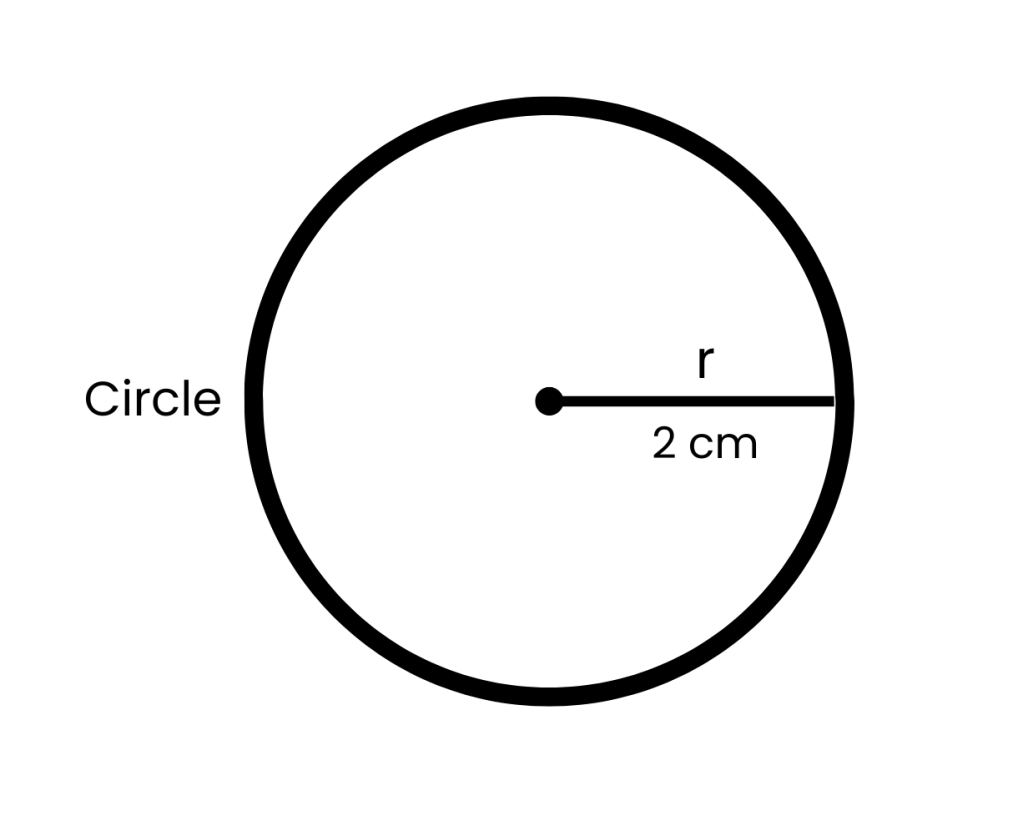
A = πr^2
A = π5^2 = 12.6 cm²
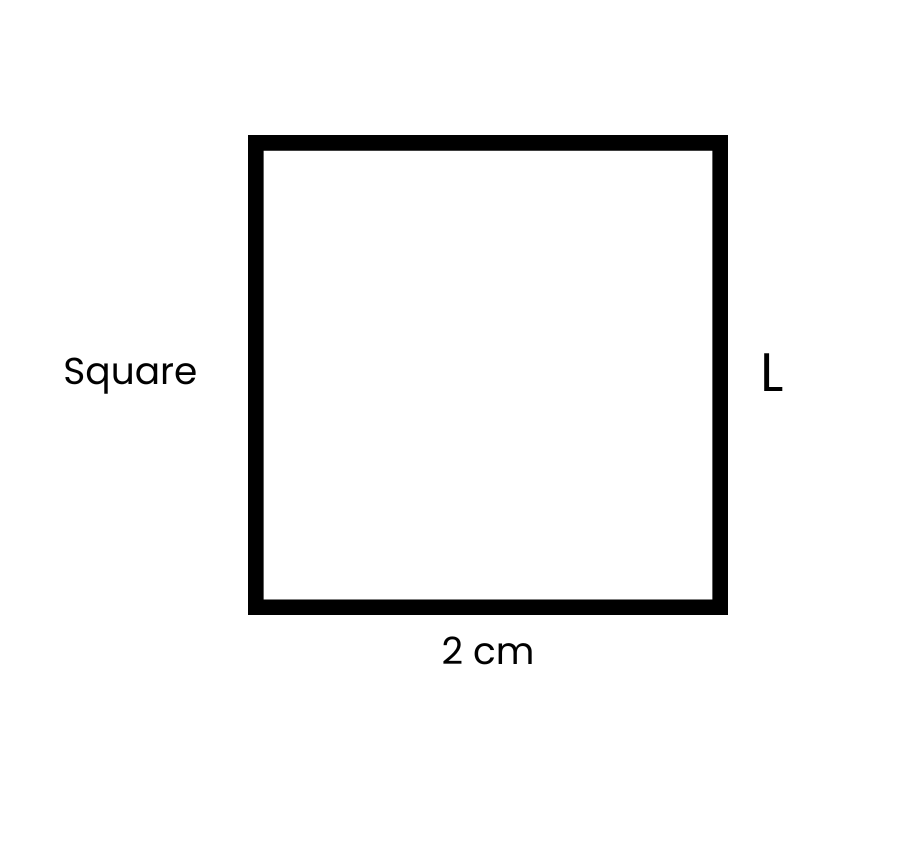
A = L × L
A = 4 x 4 = 16 cm²
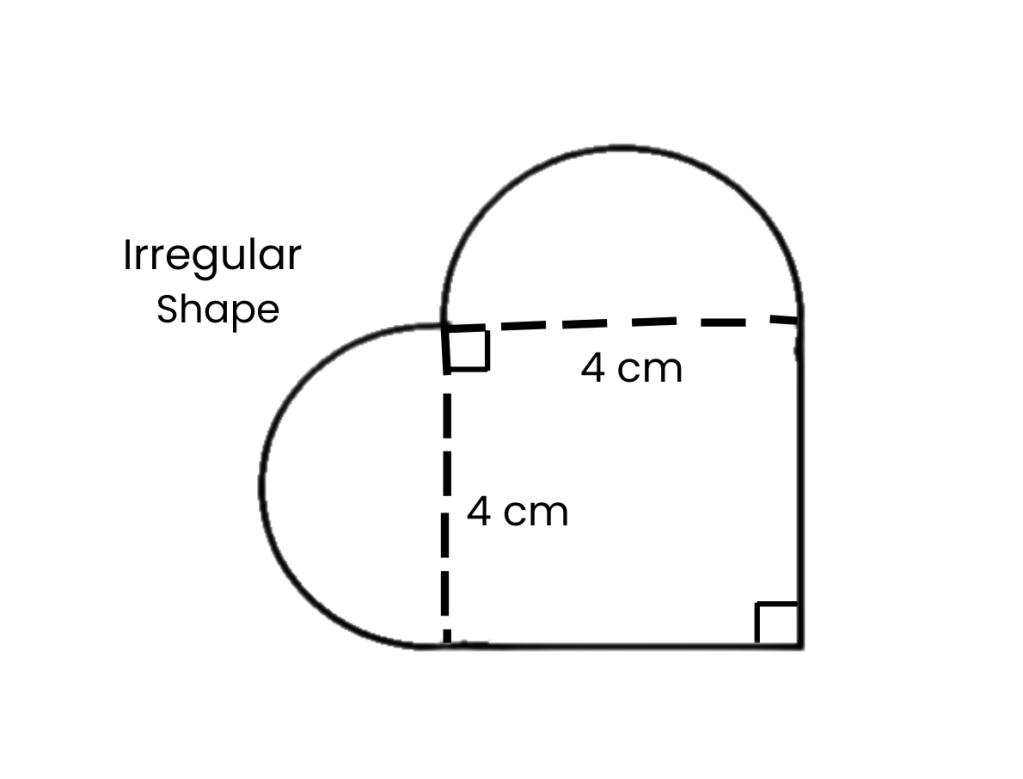
Each semi circle:
A = (πr^2) ÷ 2
A = (πr^2) ÷ 2 = 6.3 cm²
6.3 + 6.3 + 16 = 28.6 cm²
Volume
Volume: The amount of space occupied by a 3D object
It is represented in cubic units such as (m³, cm³, in³).
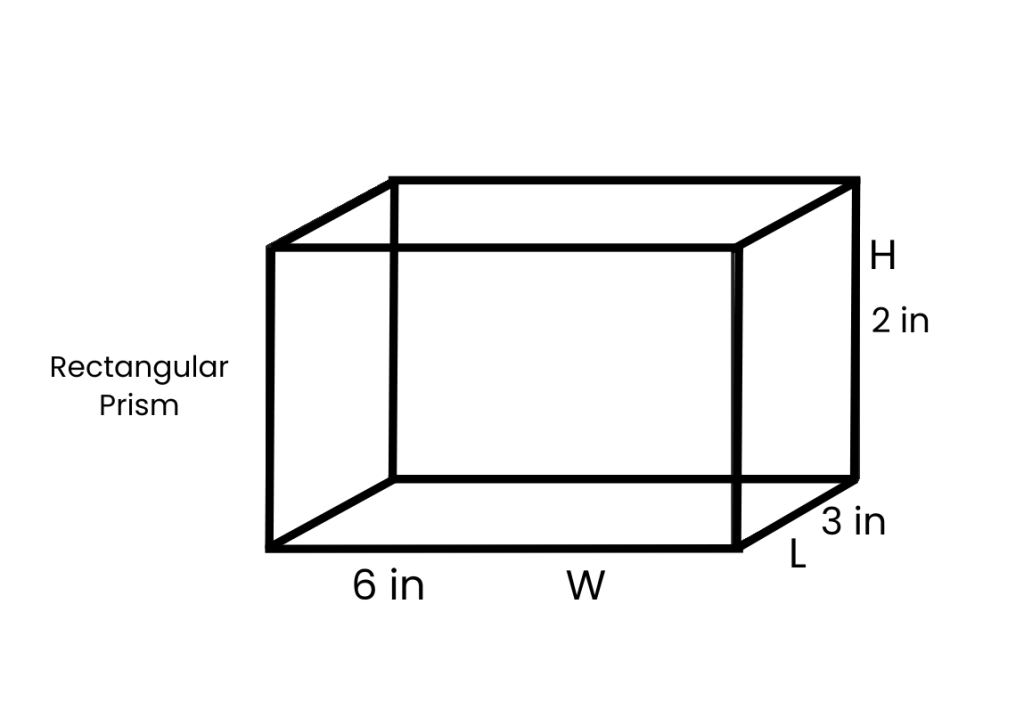
V – L x W x H
V = 3 x 6 x 2 = 36 in³
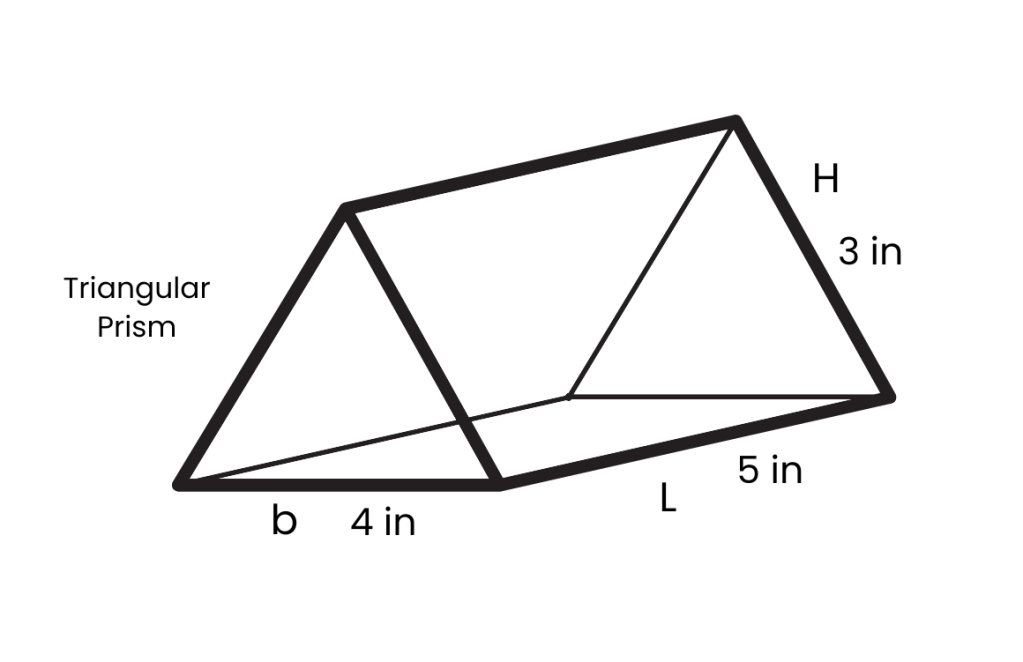
V = b x H x L / 2
V = 4 x 3 x 5 / 2 = 30 in³
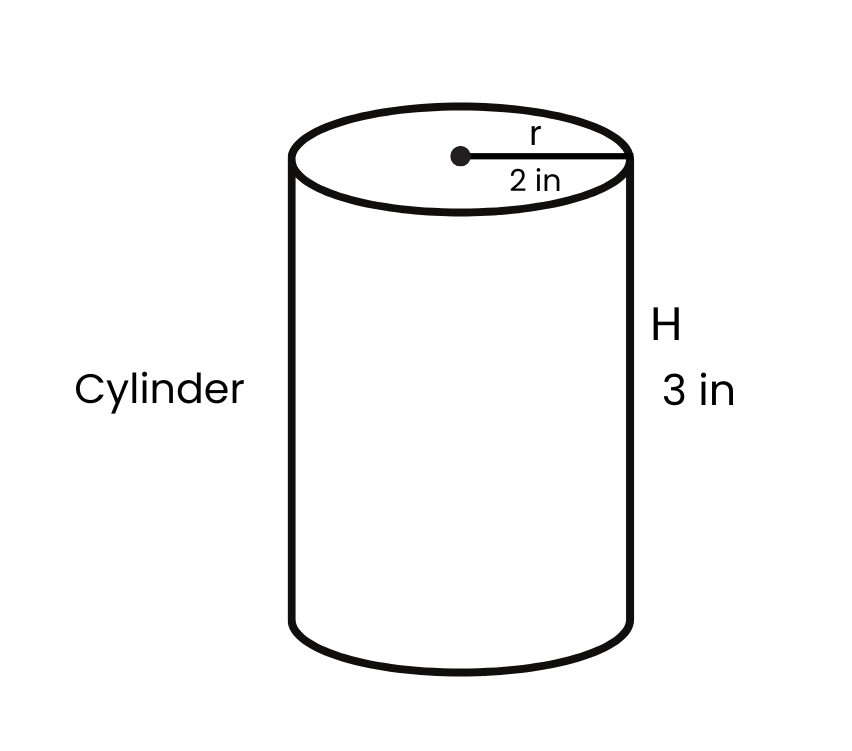
V = πr^2 h
V = π2^2 x 3 = 37.7 in³

V = πr^2 h / 3
V = π4^2 x 6 / 3 = 100.5 in³
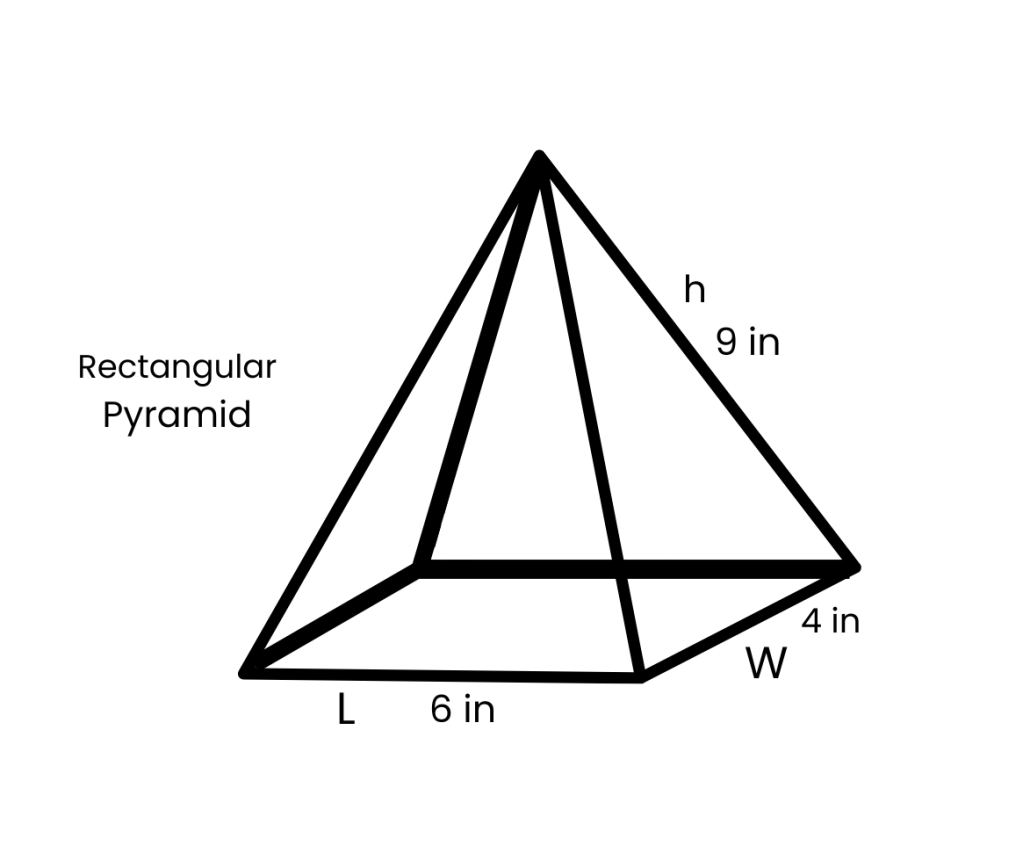
V = L x W x h / 3
V = 4 x 6 x 9 / 3 = 72 in³
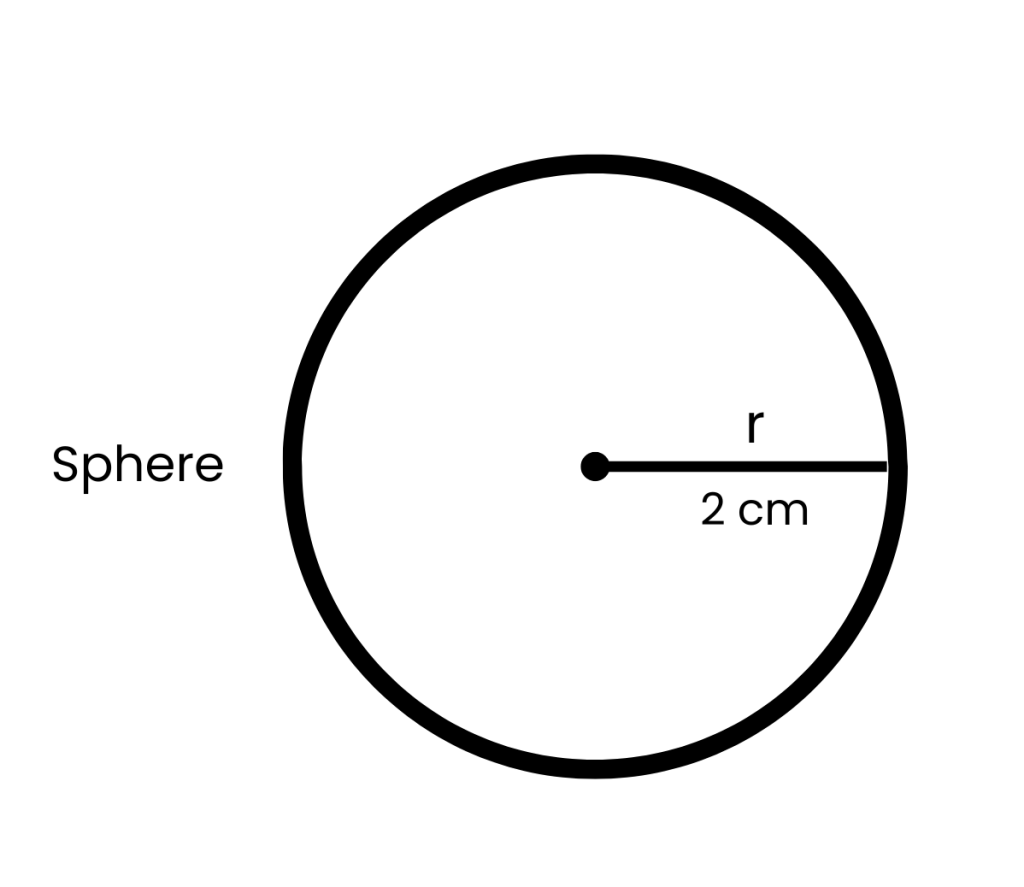
V = 4/3 πr^2
V = 4/3 π2^3 = 33.5 cm³
